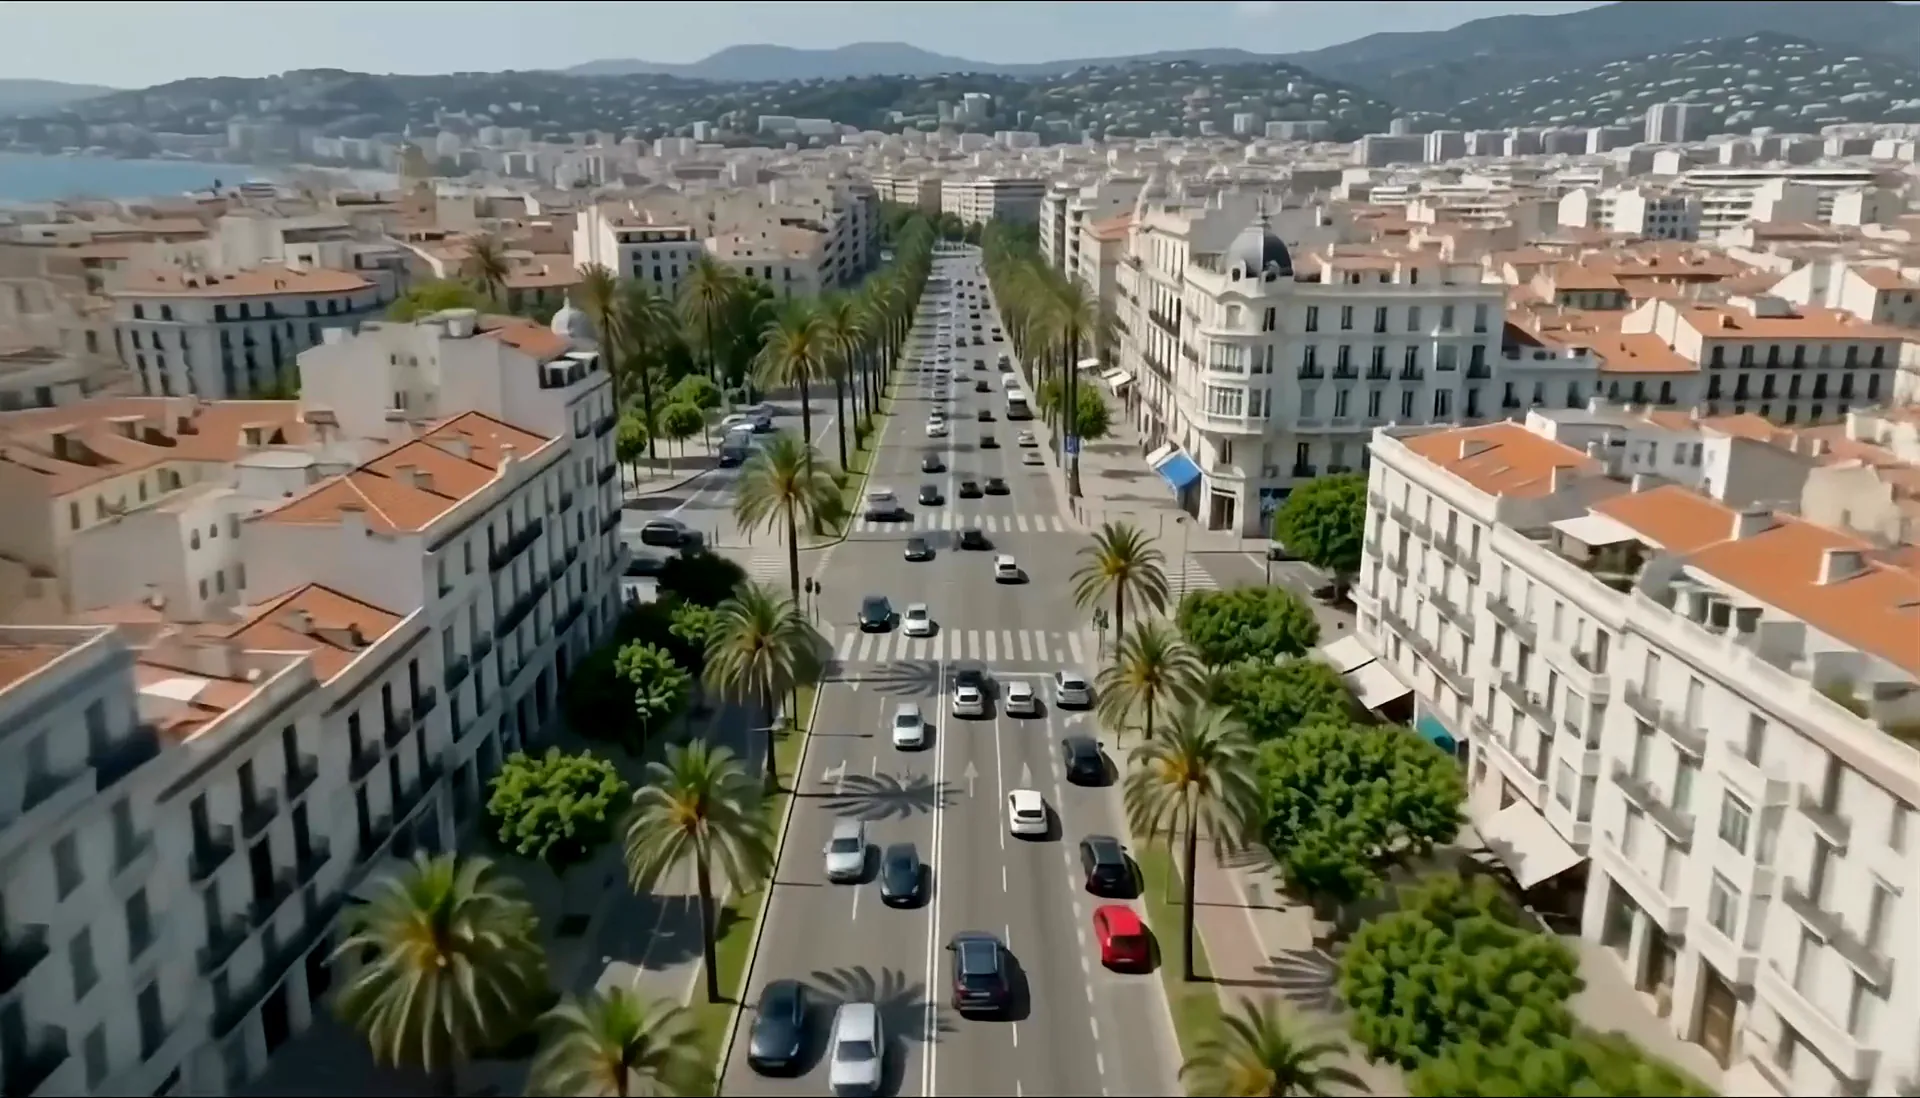
Where streets become data

At Doobl we build our own technology to turn information from the streets into useful data, for more liveable cities and better mobility.

Our technology

Our technology

Intelligence that starts in the streets.

Doobl is an urban mobility technology company that develops its own artificial intelligence models to understand the urban environment better.

We combine VIA (Computer Vision) and DiscentIA (Machine Learning) to turn street observations into structured information, identify patterns and generate knowledge that is useful for mobility.

VIA

Pilot phase

The street, turned into data.

VIA is our computer vision model, designed to identify physical elements of the urban environment and turn them into digital information. By analysing street imagery, we are working to obtain data about urban space and its features, and to understand in more detail how it is organised.

A street seen from inside a car, with elements marked: a traffic sign, a pedestrian crossing, a parking sign, bins, a motorbike and the lane line.
Illustrative image of the elements VIA is working to identify. Technology in pilot phase.

DiscentIA

Proprietary model

Data learns. Decisions improve.

DiscentIA is our own machine learning model, built to learn from data and identify patterns of urban behaviour. Drawing on the information available and on accumulated observations, it estimates parking dynamics and brings intelligence to decision-making.

Aerial view of a neighbourhood with its streets marked green, orange or red by the likelihood of finding a parking space.
  • High
  • Medium
  • Low
Illustrative image: streets coloured by the likelihood of finding a space. Not live data, nor a measure of coverage.

How it works

From streets to decisions.

One intelligence to understand our cities and improve the way we move.

  1. Source

    The streets

    Information starts in the physical urban environment.

  2. Observation

    VIA

    Our computer vision model works to identify and structure physical information from the streets.

  3. Learning

    DiscentIA

    Our machine learning model uses the data to identify patterns and generate estimates.

  4. Solutions

    Intelligence for cities and drivers

    Data for planning · Intelligence for parking

Conceptual visualisation of the Doobl ecosystem.
  • Data for planning

    Urban inventories and mobility patterns for the studies, analysis and planning decisions of companies and city councils.

    See products
  • Intelligence for parking

    Smart information to help drivers find somewhere to park.

    Meet the app

DiscentIA doesn’t learn from VIA alone: it also combines other sources of information.

Products

Data that turns streets into knowledge.

Two product lines to help companies, consultancies and public administrations understand parking and urban space better.

Inventories

What’s on our streets, and where.

We build inventories of the physical urban environment to identify, locate and structure the features of the space set aside for parking.

The goal is an organised, georeferenced database that helps you understand the parking supply and the conditions of use in each area better.

May include, subject to coverage and validation

  • Parking types
  • Bays and kerbside features
  • Signage and restrictions
  • Accessible bays
  • Charging points

Mobility patterns

How the use of urban space changes over time.

We analyse the information available to identify spatial and temporal patterns related to parking and arriving at a destination.

Where the data allows, this analysis helps to understand parking pressure, how it varies by area and time of day, and the trends that matter for urban planning.

May include, where the data allows

  • Parking pressure
  • Variation by area
  • Time-of-day bands
  • Trends over time

The scope of each line is defined project by project. We’re talking about parking and arriving at a destination, not every trip made in a city.

Data, wherever you need it.

Different ways to access Doobl’s information, adapted to what each organisation needs.

  • API

    An integration route to bring Doobl’s data into the systems and analysis tools of companies and public administrations.

  • Subscription dashboard

    A space to query and visualise urban data without having to integrate it into other tools.

Tell us about your project

Cities, companies and consultancies

The missing data for understanding our streets better.

Your technology partner for going where traditional data can’t.

Understanding how urban space is used takes information that is often unavailable, incomplete or expensive to collect.

At Doobl we develop technology to turn physical observations of the streets into structured data.

We help councils, companies and consultancies broaden what they know about parking and urban space, adding new layers of information to their current sources.

You know what your city needs. We get you the data you’re missing.

Use cases

  • Parking and urban space

    Information to understand street characteristics and the parking supply better.

  • Mobility studies and planning

    Complementary data to support assessments, parking studies and urban mobility plans.

  • Territorial analysis

    Structured information that can help detect patterns, compare areas and understand the needs of a territory better.

Available capabilities and coverage are defined project by project.

What would you like to know about your city?

Tell us what information you need, and let’s explore how we can help you get it.

Tell us about your project

Doobl App

Less circling. More living.

Doobl’s intelligence, in your pocket too.

Parking shouldn’t be the hardest part of getting where you’re going. Doobl brings public and private car parks, the odds of finding a space on the street, EV chargers and accessible bays together in one app. Compare the options near where you’re heading and pick the one that suits you best.

Search. Compare. Park.

  1. Search your destination Tell us where you want to go.
  2. Compare your options Car parks, street spaces, chargers and accessible options, based on the information available.
  3. Choose and arrive Pick the option you prefer and we’ll take you there.

Your next space starts here.

Doobl is free for iPhone and Android.

All about the app

Collaborate with us

Let’s connect technology, mobility and cities.

We’re working to build an ecosystem where urban information, parking infrastructure and people’s needs are better connected.

If you run mobility infrastructure, car parks or charging points, we’d like to meet you.

Explore partnerships

Frequently asked questions

Parking data, question by question

What is Doobl and what parking data does it provide?
Doobl is a Spanish urban-data technology company specialising in parking. It offers two product lines for councils, companies and consultancies: Inventories, a georeferenced record of the physical parking supply, and Mobility patterns, which describe how parking pressure and arrivals change by area and time of day. Behind them sit two in-house models, VIA and DiscentIA, plus a free app for drivers, Doobl App.
What does a parking inventory include?
A Doobl Inventory is a georeferenced record of the physical parking supply: parking types, kerbside characteristics, signage and restrictions, accessible bays and charging points. Which layers it includes, and in how much detail, depends on the coverage and validation available in your area, and is agreed project by project. It’s the foundation of any parking supply and demand study.
How do you measure parking pressure by area and time of day?
The usual method is fieldwork: occupancy (beat) surveys that count free and occupied spaces across several time bands. Doobl’s Mobility patterns answer the same question from data: they describe parking pressure and arrivals, and how they change by area and time of day, based on accumulated observations from VIA and other sources. The study area and time bands are defined with each project.
Can you get on-street parking data without installing sensors?
That’s Doobl’s approach. Instead of one sensor per space, VIA, our computer-vision model in pilot phase, analyses street imagery to identify physical elements of the urban environment, and DiscentIA learns from those observations and from other sources to estimate parking patterns. If you’re considering installing sensors, talk to us about your case first.
Is this data useful for a sustainable urban mobility plan (SUMP)?
The baseline assessment of a mobility plan needs to know the parking supply and how it’s used. Inventories provide the georeferenced physical supply; Mobility patterns, the pressure by area and time of day. They don’t replace the rest of the assessment — trips, public transport, active travel — but they can feed its parking chapter. Tell us what stage your plan is at.
How can data help extend a controlled parking zone or define a low-emission zone?
Extending regulated (pay-and-display) parking or drawing the boundary of a low-emission zone usually starts with knowing where streets saturate, and at what times. Mobility patterns describe that pressure by area and time of day, and the Inventory records what each street section holds: parking types, signage and restrictions. So the proposal rests on data, not just perception. The scope is defined with each council.
Are Mobility patterns the same as origin–destination matrices?
No. Origin–destination matrices, such as those built from mobile-phone data, describe trips between zones. Doobl’s Mobility patterns focus on parking: where and when pressure is highest, how it changes by area and time of day, and how arrivals are distributed. They don’t attempt to capture every trip in a city, and they can complement the travel-data sources you already use.
How do I start a data project with Doobl?
With a conversation. Tell us the area, the goal — a SUMP, a parking study, a controlled parking zone — and the timeline, and we’ll propose which Inventories or Mobility patterns fit. Coverage and validation are scoped project by project, starting from the question you need to answer.